
I’m a biology nerd into code and data science and I work as a staff member for an academic research center. I also read, write, learn, and teach. I attended the O’Reilly Strata Hadoop World Conference March 28-30 2016.
I became aware of O’Reilly conferences (and in particular the O’Reilly Strata Hadoop World Conference) as a resource of interest in 2013, while I embarked on a journey to explore options for next steps in career, and connect with people. I watched some of the keynotes, videos of which are streamed live and are freely available on the youtubes. I subscribed to Safari Books Online and totally gorged on remote-viewing recorded sessions.
All of that remote-viewing was fine, but dully one-sided — not fulfilling the connecting with people part of things. I joined some local meetups, including Seattle pyladies, and the Seattle Spark Meetup, with the intent to became more engaged. A friendly friend (@amcasari) convinced me to do a lightning talk on genomic analysis with Spark, and then to help her co-develop and co-lead a new workshop called Spark for Everyone at the Women Who Code Conference in mid-march. We will refine the workshop and offer it again at the Seattle Spark Meetup on May 12 in Bellevue.
Besides wanting to learn more technical skills, I consider the ways that technology alters our interactions with the world, and wonder what more can we do with data & technology now and in the future that will make a difference for things that I care about.
Decision Heuristics
Realizing how rare for me to attend this conference in person, I intended to take the firehose approach — immersed in a massive flow of ideas and knowledge and connections. I knew that based on the number of concurrent items on my schedule, I would need to make spontaneous choices about what to see. It’s a strange kind of pressure. Without a time-machine, remote viewing at a later date would be the only option for any session which I could not attend in person, but then I would need to find the time to remote watch, and those would not become a part of the real life experience. In general I wanted to go to talks by people I know or want to know, and to focus on what inspires me, ignites my passion, and aids me in my work.
The speaker slides are being all being collected here.
Also, I’m excited that O’Reilly offered attendees access to several tutorials on the new learning platform Oriole. If you have been living in a cave and haven’t heard about this, run do not walk to check it out. There’s a free one to try on python + regex. I also loved the probabalistic data structures in python one. I learned so much. In fact, today I had to do a small set comparison and wanted to use a bloom filter for it even though its not needed for small data 🙂
Diversity & Imposter Syndrome
I did check out what the female to male ratio in the session rooms seemed to be. Hint: super duper low. Always looking for the silver lining — there were no lines for the female specific bathrooms. I was prepared for this, though still a shocking contrast to the Women Who Code Conference the week before, where some of the talks were about how to do diversity, inclusiveness, and privilege. But I was really glad there was a Women in Data Science meetup scheduled during Strata Hadoop. It was very well attended, by all genders, and the speakers were amazing.
Packed house at Women in Big Data Forum #StrataHadoop pic.twitter.com/kuqFSS5Jwy
— amcasari (@amcasari) March 30, 2016
Kindof Blown Away by the Quality of People Here
On Tuesday evening I met some extraordinary people at a dinner, speakers at the conference. I don’t know what to say about that dinner!!! I would seriously like to know all of these people. What real people dead or alive would you invite to dinner?
On Wednesday evening we had a Seattle Data Science Meetup @ Strata Hadoop @ a Silicon Valley Data Science Party. Some of the Seattle Data Science people wanted to get together and spend some time on Wednesday night. Silicon Valley Data Science, an enterprise consulting company, hosted a lovely party which we were delighted to be able to attend. It was a fantastic evening of socializing. I met folks from Greythorn, Insight Data Science, Analytic Spot, and others. Some of us went across the street for made-to-order ice cream sandwich nightcaps.
Then on Thursday we had an impromptu pyLadies meetup at the O’Reilly Media Booth. We made toasts with Bud Light Limes.
Keynotes & Sessions Notes
Machine learning for human rights advocacy: Big benefits, serious consequences
Megan Price of Human Rights Data Analysis Group @hrdag
Megan Price used her time to tell the story of how her team uses data analysis to estimate the number of victims in the Syrian conflict. The estimates are used by the UN commission of inquiry in war crime trials during the conflict. For the trials, expert witness testimony is used, but its important that the number of deaths be convincingly established (with data science). The figure is an estimate. One component of the estimate are documented identifiable deaths. But the other component of the estimate are the missing. There are a number of documentation groups on the ground during the conflict, gathering information and stories. This data is not mutually exclusive, so the same victims could be in several lists. The technique for trying to resolve this kind of data is called entity resolution, or de-duplication.
Megan’s team offers a geeky deep dive into their techniques in a jupyter notebook format. Notebooks are part of the future of education. Well worth checking this out. #education #thefutureisnow
She describes using the output dendrograms from hierarchical clustering models — using a visualization to make individual decisions on which similar records represent unique individuals. I think that this is a kind of use case that I haven’t often heard described when people are talking about visualizations, reports, and dashboards. A scientific dashboard to help an analyst annotate their closest estimate to the truth in the data. Then a lesson learned from an analysis which they did using overlap patterns of all the data sources to model the underlying data generation process. Looking the overlap patterns, it looks like there was a plateau of violence. But without external knowledge, that hypothesis would have been ‘exactly wrong’. There was a bias (i’d be tempted to call it a kind of selection or detection bias) in the data- much less data got collected during times of peak violence.
Nonsense Science
Paula Poundstone
Paula Poundstone really poked fun at sacred cows here, and delivered something which was probably either like being teased horribly by a relative, or like finally running into someone who you can totally relate to because they tell you the truth, depending on your mindset. It was delivered as a truth bomb in a perfectly comedic slurry — how we science and technology people tend to express our beings in the world. We got a treatment on jargon, how we are always looking at our ‘flat things’, our self-importance & self-absorption, and our introversion and tunnel vision. Not a few individuals and companies got live roasted.
@adafruit shout out, Laura Waller, Gigapixel images #HardcoreDatascience #StrataHadoop #Fourier pic.twitter.com/AA8eDdh0gQ
— priya joseph (@ayirpelle) March 29, 2016
Data science for good means designing for people: Part 1 & Part 2
Jake Porway (DataKind), et al.
These were short talks and panels. I learned about the UN’s Sustainable Development Goals, which are like KPIs for society. Unlike the previous UN goals which were top down, every country in the world negotiated these goals. Getting the data for monitoring these goals can be very hard. For example, for monitoring of maternal deaths, we only have data for 16% of world births. There is a global partnership for sustainable development data with 114 members (ie facebook, govt of kenya, etc. ). I learned about flowminder.org.
Lucy Bernholz talked about a conversation that needs to continue about the digital civil society. That there needs to be a voluntary use of private resource for public benefit/purpose in digital age. Because the marketplace / government is not going to be able to do everything which is needed with data. Also talked about privacy, liability, and data collection. Consent is very important, and to remember that its a voluntary relationship. Design collection such that you assume you cannot protect the data.
The state of visualization: Application and practice
Noah Iliinsky (Amazon Web Services)
Noah is a friend of mine. I had not seen him speak before and i’m interested in this topic. Sharing visualizations is democratizing!
He has a pinned tweet which describes the correct approach for choosing a visualization.
Step 5: What graph do I use?
4: What data matters?
3: What Q’s need answering?
2: What actions do I need to inform?
1: What do I care about?— Noah Iliinsky (@noahi) January 17, 2014
For Step 1 and 2, one example of figuring out what you care about and actions to inform might include thinking about your endpoint. Dashboards are for operators who need to do something immediately based on the data. Figure out what you care about and the rest is noise. Keep all noise off of dashboards! Reports, to contrast, are for long-term management, no immediate actions required. There are way more things to care about than dashboards and reports, this is just an example. What you care about may be completely different! eg. a scientific question that you have.
For Step 3, think about jeopardy. If you don’t understand the question your graph is answering, its a bad answer
I think a website Noah showed us helps illustrate this very clearly: Do I Need An Umbrella?
For step 4, I can’t think of what goes with this. I don’t really know if the other points even intentionally matched with the step numbers. Too late now.
For Step 5, its good to keep certain principles in mind, such as: humans are very good at seeing horizontal and vertical difference; we get that for free as part of our sensory interface. Use bars for that type of thing. Never do 3d: They distort the data and It’s not visually interpretable. Lines imply time.
Testing and validating Spark programs
Holden Karau (IBM)
Holden is awesome. I’d given feedback for one of her Spark books, Learning Spark, and she had been receptive to that. She’s also been very encouraging to me about participating in open source. I’m excited for her new book to come out, High Performance Spark. Holden has written a test module to test your Spark Programs.
I actually have no formal training in software development, but I am familiar with Spark, and I want to learn about testing. Testing and validating is good for many reasons. Sometimes, your results get automatically shipped to production, so you want to make sure they don’t fail. Things can fail for so many reasons, so the more robust the tests the better.
There are a few libraries to use for Spark testing. Unit testing, integration testing, performance testing. Its great if your code works, but there are special problems to testing your code at scale. Coming up with the data for such tests can be hard. Use QuickCheck/ScalaCheck. It looks really useful!! Like it generates its own test data. We can actually generate data for tests of spark streaming, and even for dataframes. We can generate test data using a specific schema! Or we can use a method to generate random data, if we need something with a certain distribution.
For Spark validation, we generally want to check file sizes and execution time.
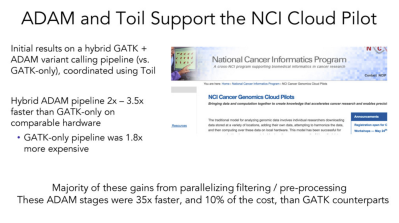
Cancer genomics analysis in the cloud with Spark and ADAM
Timothy Danford (Tamr, Inc.)
This talk was in the last slot of the conference (graveyard shift). What the silly? This talk should have been much earlier. I am keen on this work and possibilities, and have done various things with Spark and ADAM and look forward to doing more. There should be a whole conference for this topic!!!!! I wasn’t really the target audience for this talk, but I support it completely. Timothy did a great job of distilling the complexity of the subject. We need more bridges between genomics and big data science and engineering.
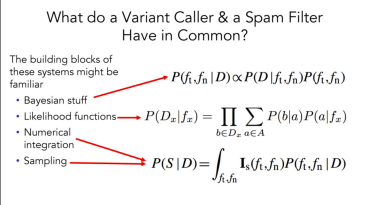
There are specialized bioinformatics pipelines of standalone tools, within bioinformatics pipelines, but the very basic building blocks of them are often familiar. ADAM contain a data model, and common operations.
Toil is a python module to wrap standalone tools. Toil + ADAM benchmark against GATK looks pretty sweet
Python scalability: A convenient truth
Travis Oliphant (Continuum Analytics)
This talk was interesting to me for 2 things: Bokeh, and dask
Bokeh. I had previously spoken with some folks at the anaconda booth specifically about bokeh, with the question of whether or not one could use bokeh to do a visualization on distributed data (eg. on hdfs), without bringing it all to one machine. They seemed to think it’s possible. And Travis demonstrated what I think was that, at least the “all the data” part, but I’m still not 100% certain about the non-locality part and need to look into it more. Anyone know the answer?
Dask. As someone who has been studying the Spark framework and its many language APIs, its been interesting to see how the project has developed. pySpark and SparkR and both language APIs with limitations. For pySpark, the python processes have to run on the jvms, and suffer from additional serialization costs. I wanted to see what was up with Python scalability, and in this talk I learned about dask for distributed high performance python.
Dask is a distributed (data locality aware) scheduler, written in python. hdfs.py talks directly to native python code — you don’t need an execution context. Dask does not use special python libraries- if the regular python algorithm is paralellizable, it schedules blocked execution. Dask can run on a single machine with multiple cores, or on any cluster including Hadoop.
Format wars: From VHS and Beta to Avro and Parquet
Silvia Oliveros (Silicon Valley Data Science), Stephen O’Sullivan (Silicon Valley Data Science)
Avro and Parquet are so cool, I always want to learn more about them.
A few of the sessions I plan to watch ASAP from the recordings
Scala and the JVM as a big data platform: Lessons from Apache Spark
Dean Wampler (Lightbend)
We enhance privilege with supervised machine learning
Michael Williams (Fast Forward Labs)
Docker for data scientists
Michelangelo D’Agostino (Civis Analytics)
How to make analytic operations look more like DevOps: Lessons learned moving machine-learning algorithms to production environments
Robert Grossman (University of Chicago)
Data scientists, you can help save lives
Jeremy Howard (Enlitic)
Thanks for reading.
Thank you to O’Reilly Strata+Hadoop World Conference, and to Seattle Spark Meetup.
Until …
